Technical resource
Mechanical testing of materials and welds: what the results actually tell you
A tensile test pulls. A hardness test makes a controlled dent. An impact test strikes a notched specimen. They answer three different questions, and one good result does not stand in for the others. A transverse tensile break in parent metal tells you the joint carried the load. It does not tell you the weld metal’s yield strength, its ductility, or how it behaves when struck cold.
What did this test actually measure? Everything else follows from the answer.
The basic definitions in plain language
Start with these meanings. The diagrams and examples that follow show how we measure them.
- Stress
-
How much force acts on a material. It is expressed as Load / Area. The imperial unit PSI is the most useful to picture it. Pounds per square inch: 1 PSI is 1 pound over 1 square inch. 50 PSI is 50 pounds over the same 1 square inch. The metric version is measured in MPa (N/mm2), same concept.
Stress can be compressive, being squashed, or tensile, being pulled. Both are measured in the same units.
To reinforce the concept of stress think what would hurt more, a 5 kg load on a 10 mm bar being pushed into your palm, or a 5 kg load on a 1 mm GMAW wire being pushed into your palm. I know which one I would choose, the lower stress on the 10 mm bar. Both have the same force of 5 kg, but the larger area of the 10 mm bar has lower stress.
In a tensile test, engineering stress is the pulling force divided by the specimen’s original cross-sectional area. Think: how hard is each square millimetre being pulled?
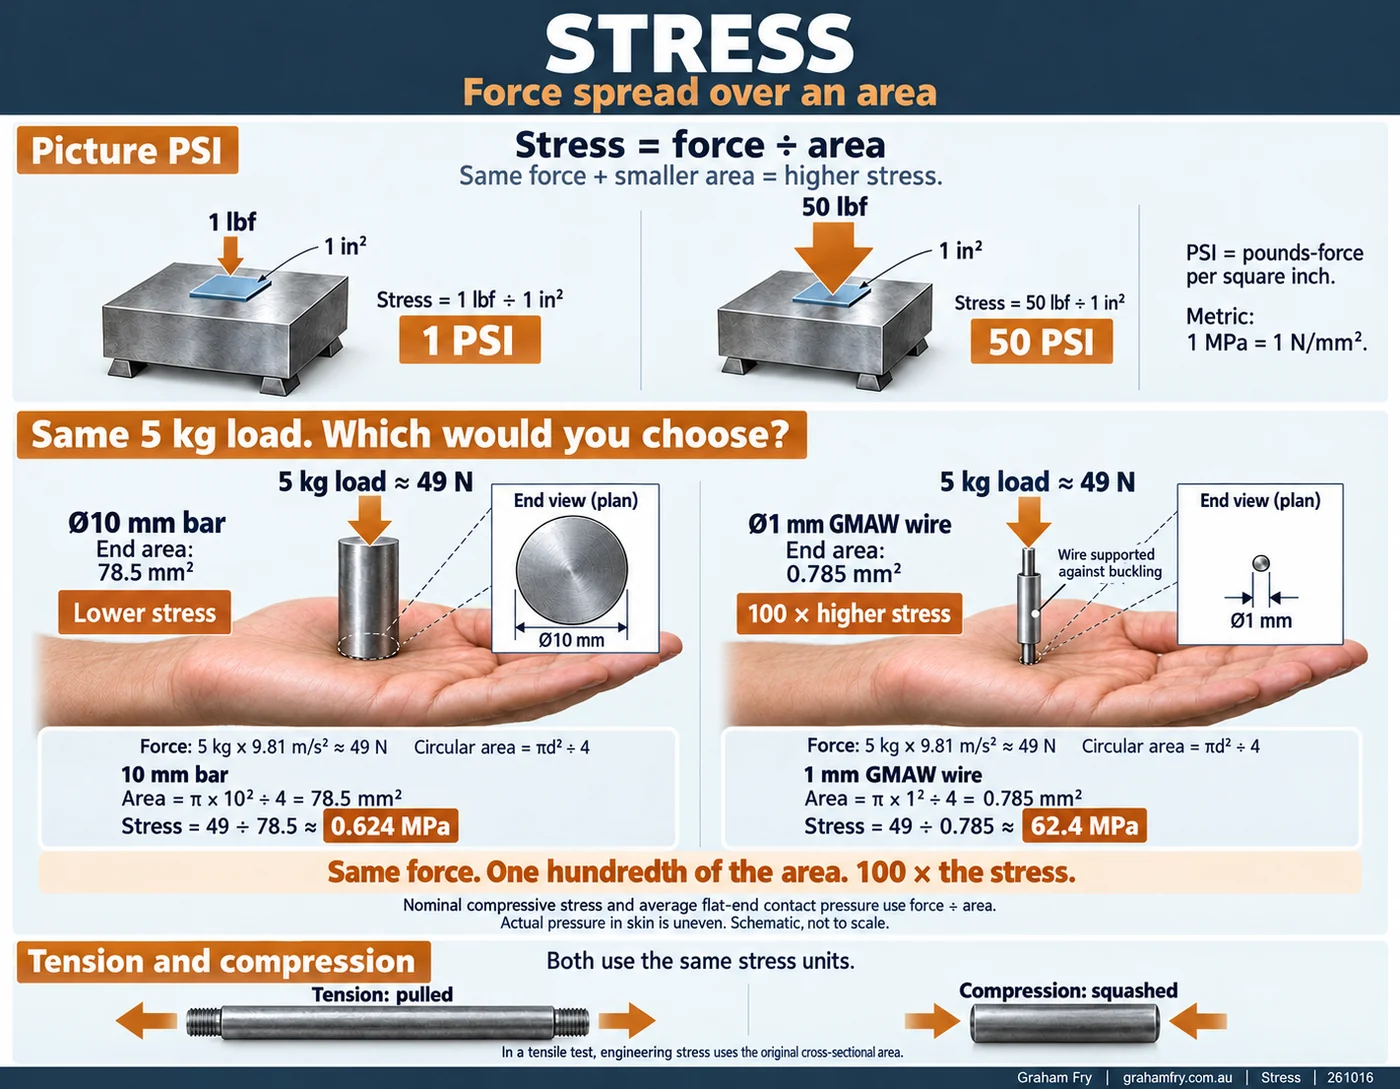
Figure 1. Stress depends on both force and area. The two 5 kg loads are equal; the 1 mm wire has one hundredth of the end area of the 10 mm bar, giving 100 times the nominal stress. Palm contact is an idealised comparison. - Strain
-
How much the material stretches compared with its original length. Think strain a muscle. You place too much stress on the muscle by lifting too much, then the muscle stretches or compresses too much. It gets strained, yields or gives.
In a tensile test, engineering strain is the increase in length of the test coupon. Strain measures a change in length relative to the original length, often expressed as a percentage. A 100 mm length stretched to 110 mm has 10% strain. Strain can include recoverable elastic stretch (a rubber band returns to its original size and shape) and permanent plastic stretch (bend a piece of plastic too far and it stays bent).
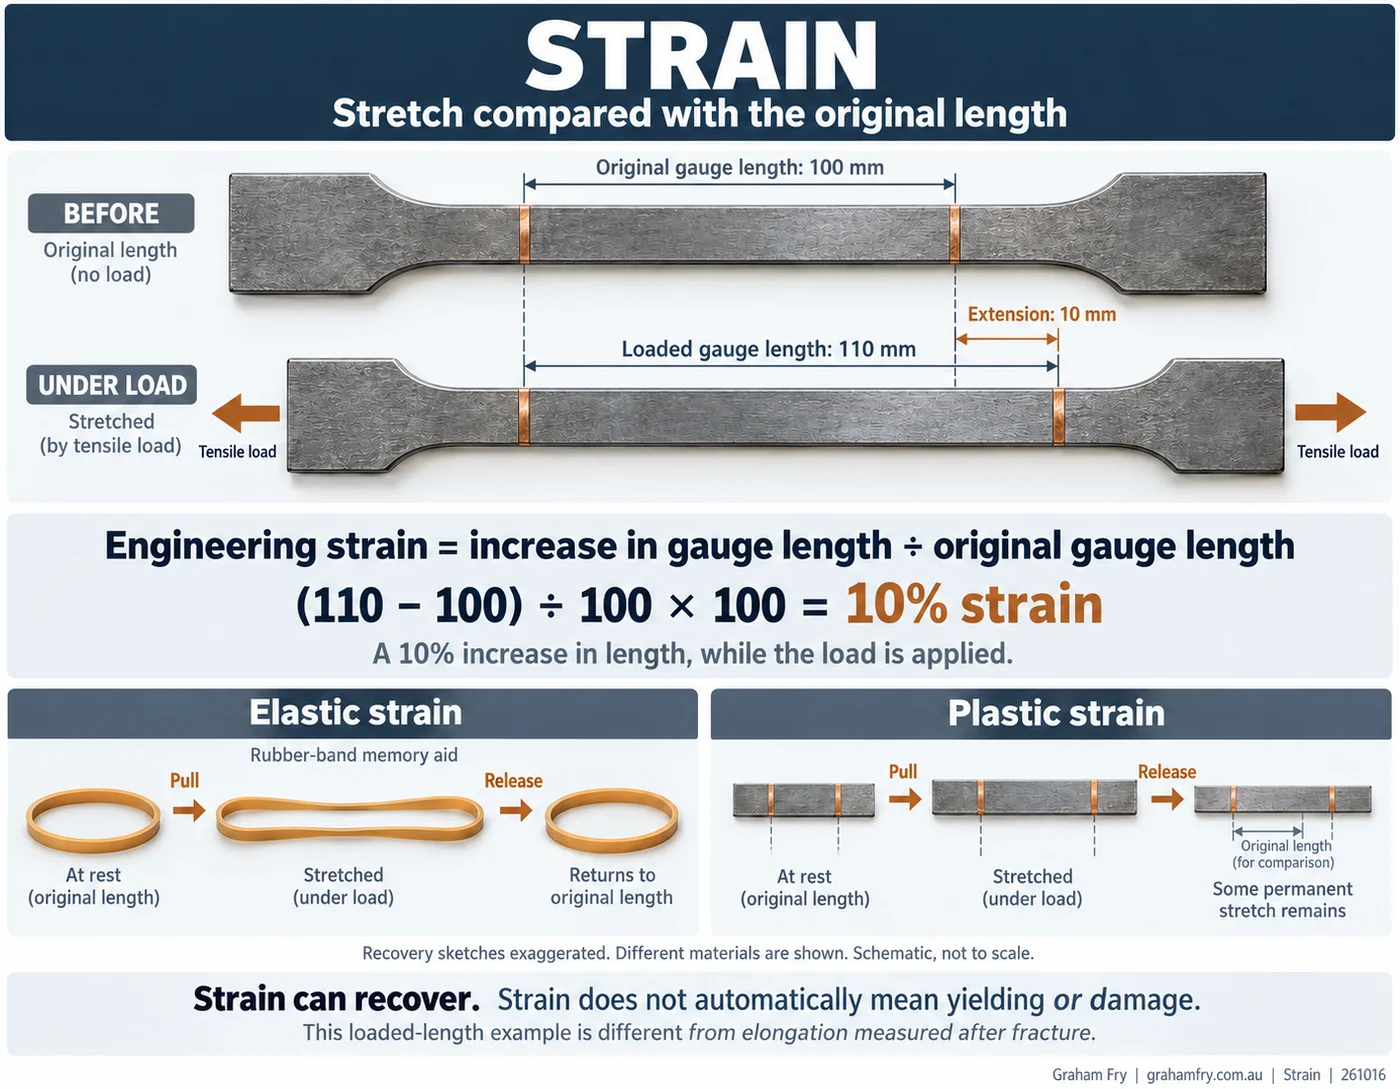
Figure 2. Increasing the gauge length from 100 mm to 110 mm gives 10% engineering strain under load. Elastic stretch recovers; plastic stretch leaves a permanent change. The recovery sketches are exaggerated and show different materials. - Ultimate tensile strength (UTS)
The highest pulling (tensile) stress reached during a tensile test. Think of a weightlifter’s maximum effort: how strong? For metal, we divide the maximum force by the original area, Load / Area. It is not necessarily the stress at the instant it breaks.
- Yield
To ‘give’ under load, when it starts changing shape permanently. Simply stretching is not enough to call it yielding; elastic stretch springs back.
- Yield point or yield strength
The stress at which the test shows definitive evidence of yielding. The specimen has started to stretch permanently. It reached the ‘point’ it ‘yielded’ or permanently stretched. If there is no clear point, like for aluminium, a specified proof strength is used instead.
- Elastic limit
The greatest stress from which the material returns without a permanent change when unloaded. So it didn’t reach its yield point.
- Plastic deformation
If you exceed the elastic limit, it permanently stretches. This means it has exceeded its yield point. It has permanently changed shape. It has plastically deformed.
- Ductility
How much the material can permanently stretch or change shape under a pull before it breaks. In workshop terms: how much did it ‘give’ before it breaks.
- Elongation after fracture
A measure of ductility: how much longer the marked gauge length is after fracture, with the broken halves fitted together. If it didn’t increase much in length before breaking it has low ductility.
- Reduction of area (ROA)
Another measure of ductility: how much the cross-sectional area shrank at the fracture. Elongation measures longer; ROA measures thinner. If it didn’t reduce in diameter, say to 9 mm before breaking, it has low ductility; if it reduces a fair bit, say to 6 mm, it has good ductility.
- STRA / Z quality
Through-thickness ductility: how much a tensile specimen pulled through the plate thickness reduces in area at fracture. Z quality specifies through-thickness properties.
- Toughness
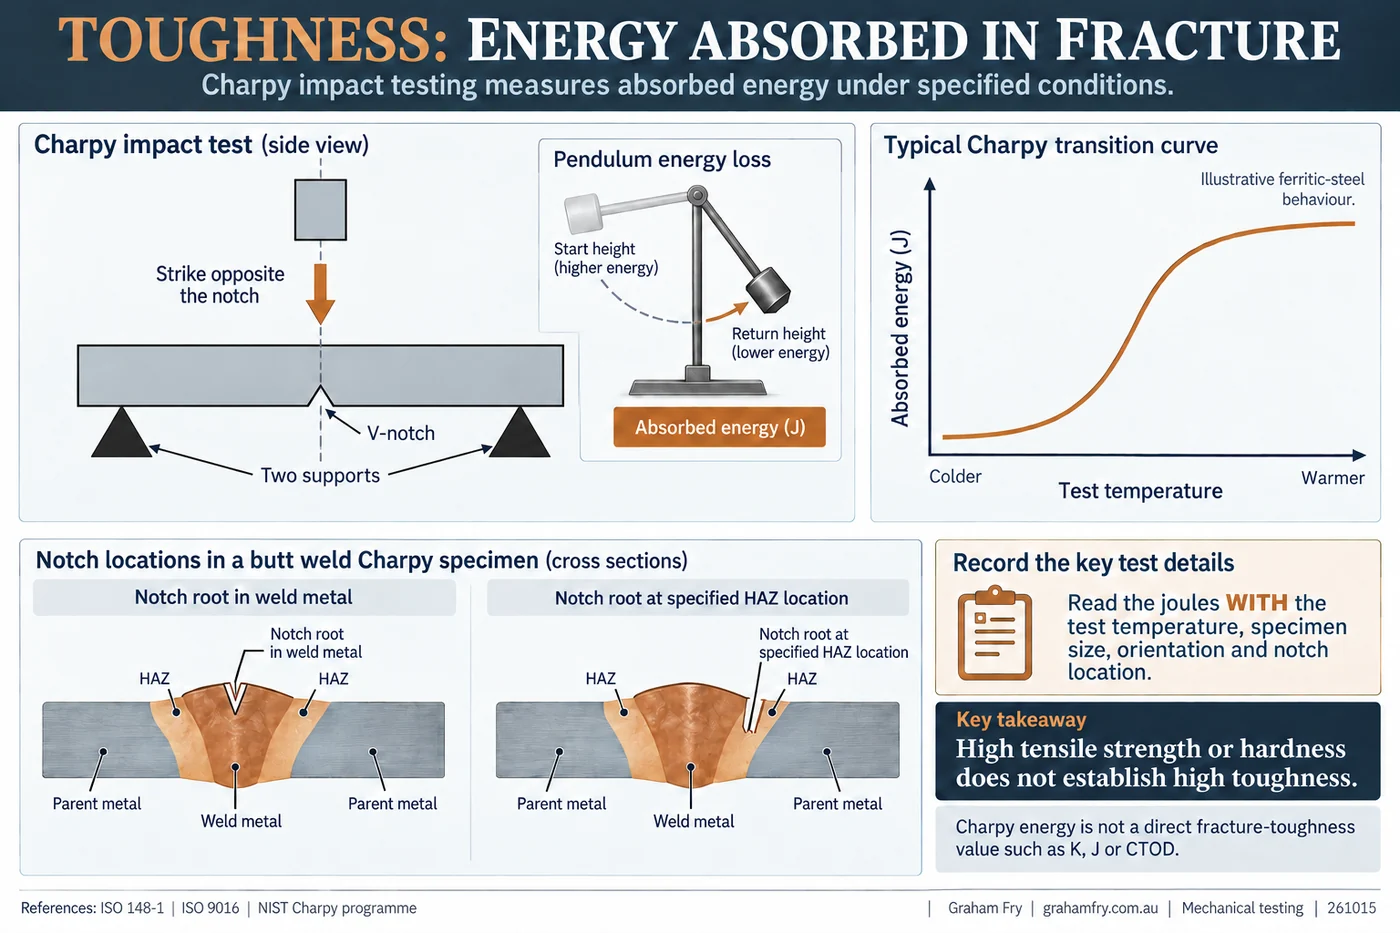
The ability to absorb energy and resist fracture. For impact toughness, think of a boxer taking a blow: how tough at the given temperature? The Charpy test measures absorbed impact energy under specified conditions. This is different to tensile or yield strength.
- Hardness
Resistance to indentation: how difficult is it to make a permanent dent? A good measure of resistance to abrasion or wear.
A weightlifter is a memory cue for strength; a boxer is a memory cue for impact toughness. The material test, specimen and conditions give those words their engineering meaning.
One good result cannot stand in for the others
A transverse tensile specimen breaks in the parent metal after reaching the required tensile strength. Someone says, “Good. The weld is stronger than the plate.”
There’s a useful result there. But it hasn’t told us the weld metal’s own yield strength, how much it can stretch, or how it behaves when struck at low temperature.
I use one question to keep the interpretation straight: what did this test actually measure?
Mechanical tests answer different questions. A tensile test pulls. A hardness test makes a controlled dent. An impact test strikes a notched specimen. One good result cannot stand in for all the others.
Start with where the specimen came from
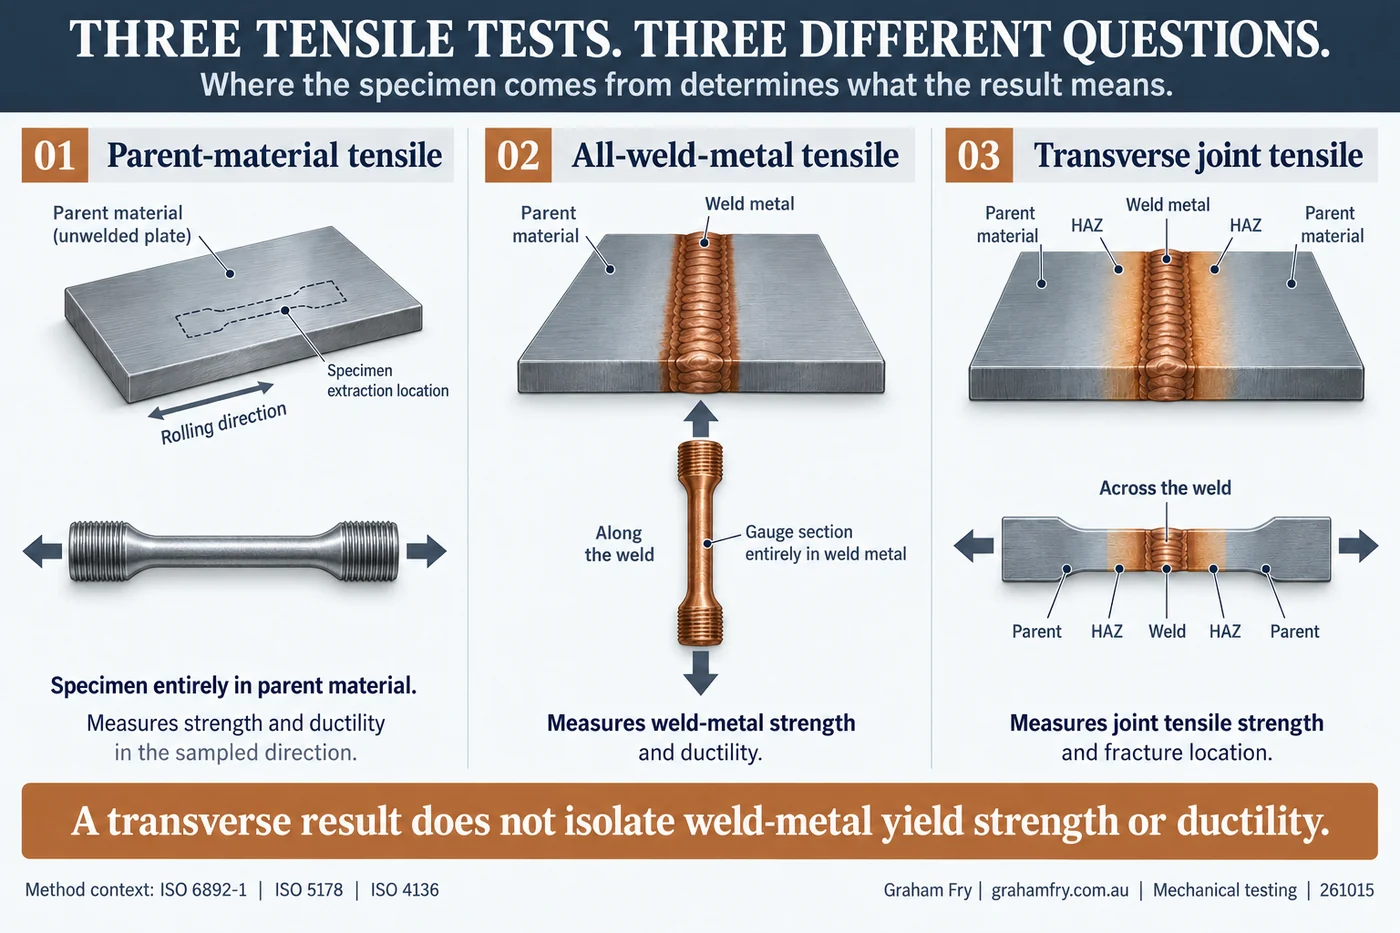
A welded joint contains parent metal, the original material; weld metal, the metal that melted and solidified in the weld; and a heat-affected zone (HAZ), parent metal changed by the welding heat without melting.
Those regions can behave differently. Choosing the right specimen matters before the testing machine starts.
Parent material tensile test: the original material
The specimen comes entirely from unwelded plate, pipe, bar or another product. It measures the sampled material’s tensile properties in the direction and condition tested. A result along a plate is not automatically evidence of its properties through the thickness. These are typically cylindrical samples.
All weld metal tensile test: the deposited metal
The specimen’s entire reduced parallel test section lies within weld metal. In a longitudinal weld-metal test, it runs along the weld. This allows the deposited metal’s strength and ductility to be measured without parent metal and HAZ sharing that section. The weld joint is set up in such a way that dilution of the base material into the weld is minimised.
It is deposited weld metal being tested, rather than unused wire or an electrode. The welding conditions and any heat treatment matter. A consumable data sheet’s typical results are not a guarantee of identical properties in every production weld. [1, 2]
This is the test that is performed to classify the consumable or do a batch test, that is test a batch (or heat number) of the welding consumable. These are typically cylindrical samples.
Transverse tensile test: across the joint
The specimen crosses parent metal, HAZ, weld metal, HAZ and parent metal again. It establishes the joint’s transverse tensile strength and where it fractures. It does not separately measure each region’s yield strength or elongation. [3] These are typically a dog bone flat strap type sample.
Remember the chain
Pulling a complete chain (transverse tensile) tells you what the load path carried and where it broke. Testing one link separately (parent material or all weld metal tensile) tells you about that link. The links that survived the whole-chain test haven’t had their individual limits measured.
Testing the load path does not measure every part separately.
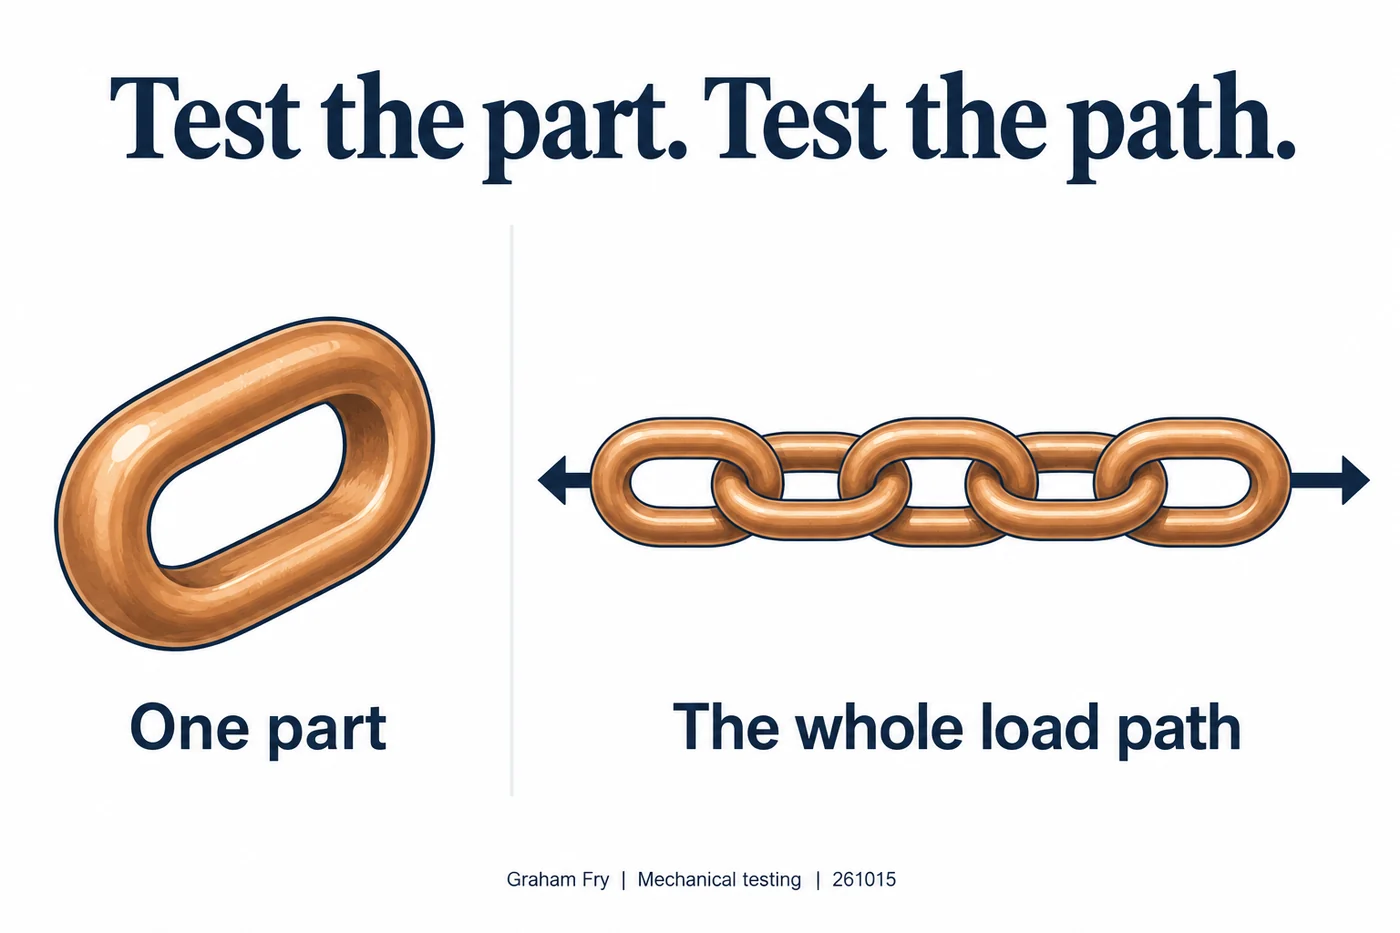
Where the analogy ends: a welded joint is continuous metal, with different regions influencing one another. It isn’t a row of detachable links, and its result is not simply the lowest individual material strength.
Supervisor note: a parent-metal fracture has limits
The weld region sustained the load reached in that test, but its own ultimate tensile strength remains unknown. Check the reported strength, fracture location and governing acceptance requirements together. Fracture location alone is not a pass, and a tensile pass does not establish toughness or freedom from every flaw.
First it stretches back, then some stretch stays
Two terms help you read a tensile test. Engineering stress is force divided by the specimen’s original cross-sectional area. Strain is the change in gauge length divided by its original length. The gauge length is the marked or measured length used for the test.
Stress is usually reported in MPa. One MPa equals one N/mm2. A bigger piece can carry more force without its material having a higher tensile strength.
Remember the spring that stays stretched
Give a spring a modest pull and release it. It returns. Pull it too far and release it, and it can stay longer.
The useful distinction is recovery. Elastic deformation recovers when you unload; plastic deformation leaves a permanent change. The specimen can contain both while it is loaded.
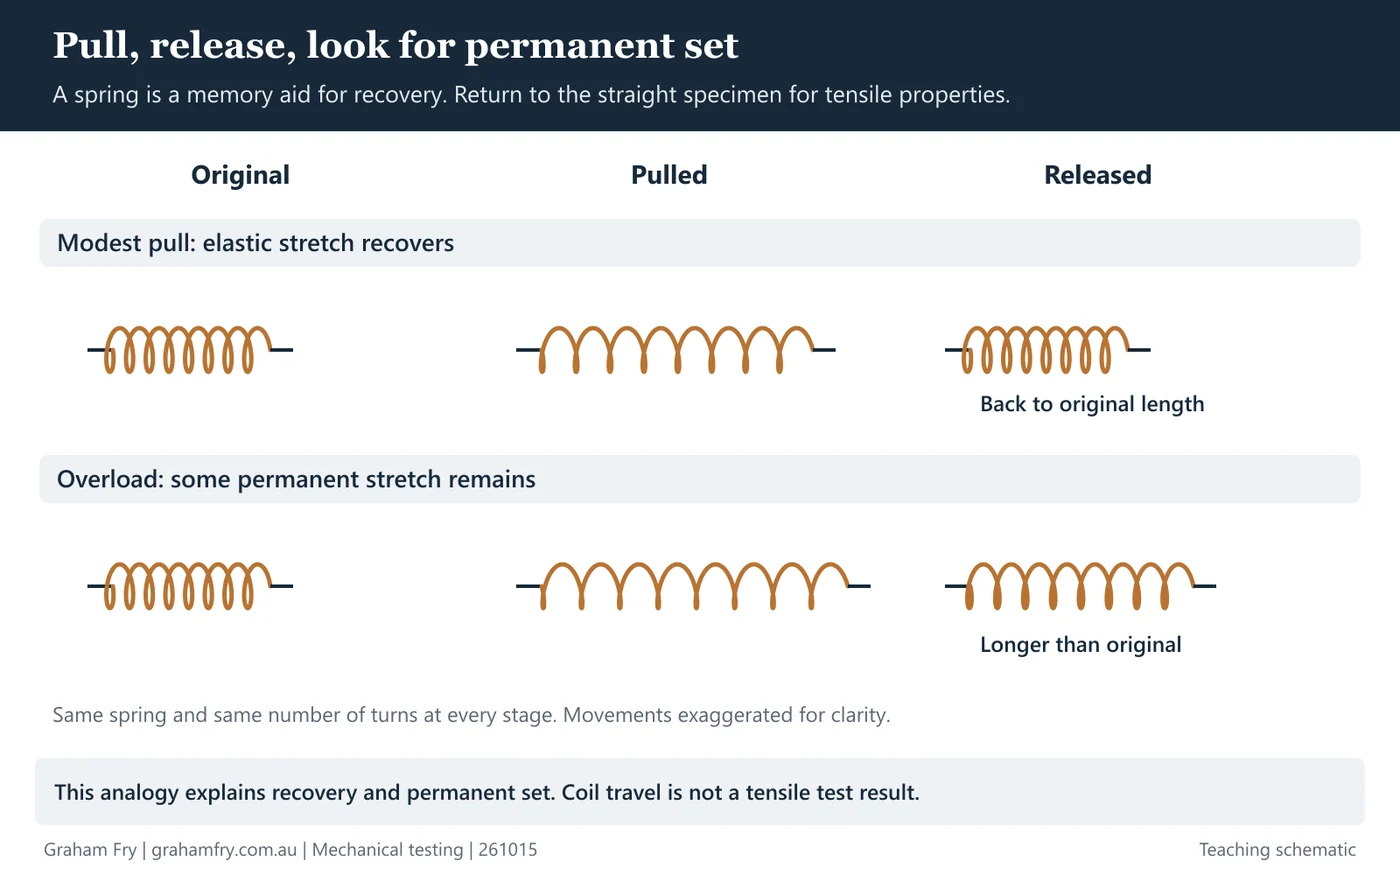
Where the analogy ends: the wire in a coiled spring mainly twists. A tensile specimen is pulled straight. The spring explains recovery and permanent set, not numerical tensile properties or the whole stress-strain curve.
Elastic limit: the last fully recoverable stretch
The elastic limit is the greatest stress that leaves no permanent deformation after unloading. Above it, the specimen still recovers its elastic stretch, but some permanent stretch remains. “It didn’t break” does not mean it stayed elastic. [4]
Yield point: permanent deformation becomes established
Some steels show a distinct upper yield point, a drop to a lower yield region and a period of further stretching with little increase in stress. Other metals yield gradually, without a sharp point.
That is why a report may give 0.2% proof strength, Rp0.2. It is the stress corresponding to 0.2% permanent strain. On the graph, a line starts at 0.2% strain and runs parallel to the initial straight elastic slope. Its intersection with the curve gives Rp0.2.
For a 100 mm gauge length, 0.2% corresponds to 0.2 mm of permanent extension. The total extension under load also includes elastic stretch, so it is greater. Proof strength is a defined reference, not the exact elastic limit. [5]
Supervisor note: read the property actually reported
Upper yield, lower yield and proof strength are different reported quantities. Use the definition required by the material specification. The proportional limit, the end of straight-line stress-strain behaviour, is another distinct concept. Neither a yield result nor a proof result is, by itself, the allowable working stress of a structure.
UTS is the highest engineering stress reached
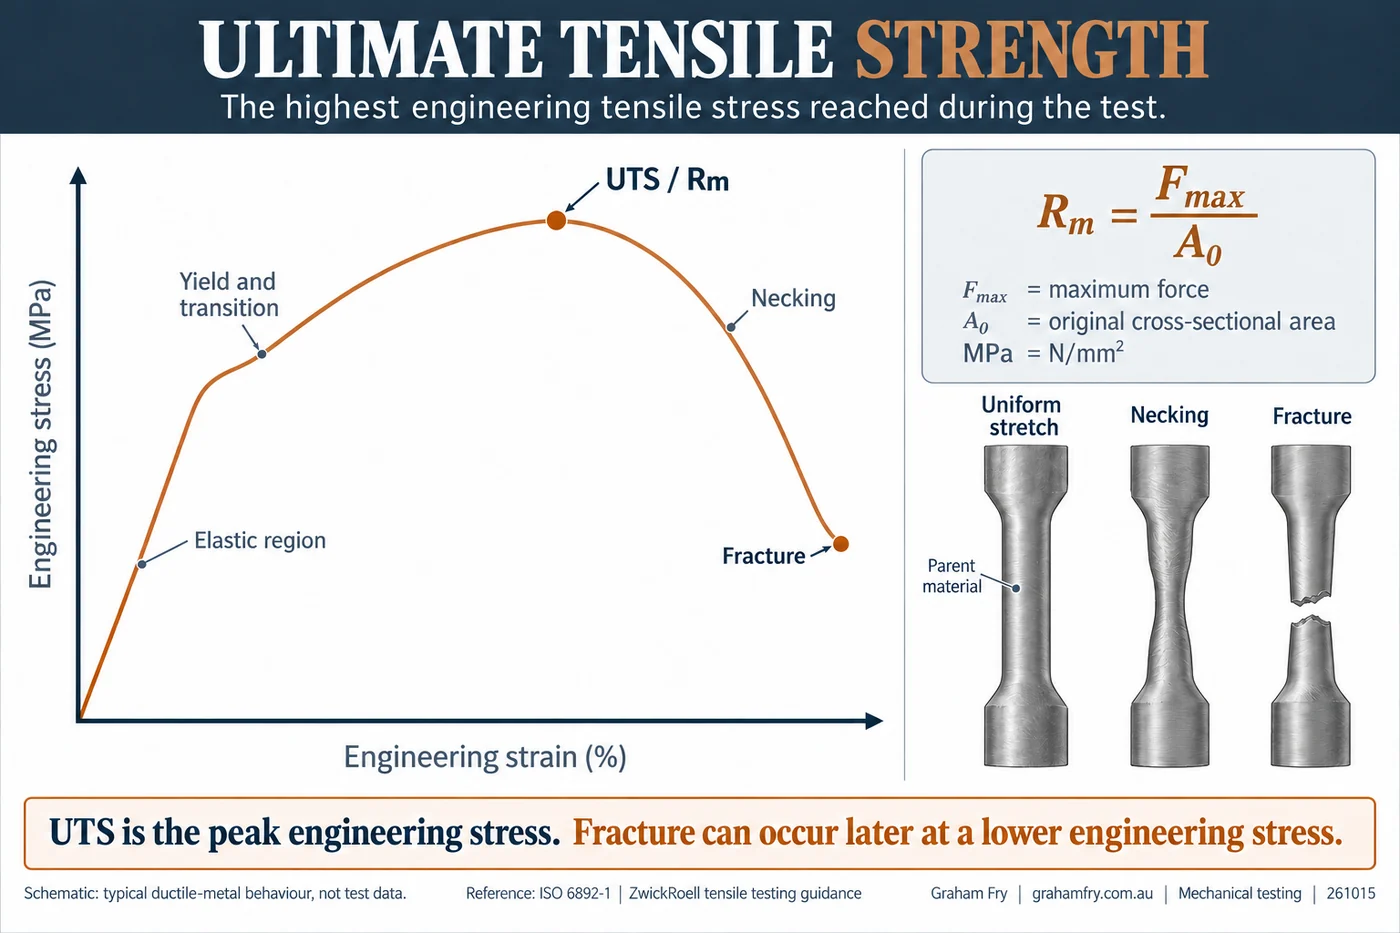
Ultimate tensile strength (UTS or Rm) is the highest engineering tensile stress reached during the test:
UTS = Load / Area
or more correctly: maximum force ÷ original cross-sectional area
Note when you look at the chart generated during the tensile test the Y axis is stress, the X axis is strain. Put simply it’s the amount of pulling pressure plotted against how much it is being stretched.
A typical ductile metal keeps stretching after yielding. Its resistance to further deformation rises through strain or work hardening. It reaches maximum force, then develops concentrated thinning called necking. Fracture follows.
The peak of the engineering stress-strain curve is UTS. The fracture point can sit farther along the curve at a lower engineering stress. Use maximum force in the calculation, rather than assuming the force at final break is the maximum. [6]
Supervisor note: the falling curve can mislead
Engineering stress continues to use the original area while the neck becomes smaller. A falling engineering curve does not establish that the true local stress in the neck is falling. Also keep strength separate from stiffness: the initial elastic slope describes stiffness, not UTS.
Ductility shows how the specimen changes before fracture
Ductility is the ability to deform plastically before fracture. In a tensile test, it tells us how much the material can permanently stretch and narrow before breaking. Generally the more the better. Elongation and reduction of area are both measures of ductility. They tell us how much it gave, using different measurements.
Ductility and malleability are related, but the words have different meanings. Ductility here concerns a pull; malleability concerns permanent forming under compression, such as hammering a metal into shape. [19]
Elongation is how much longer it got
Mark the original gauge length, pull the specimen to fracture, then fit the broken halves together. Measure between the same marks again. Elongation after fracture is the permanent increase as a percentage of the original gauge length. [7]
Elongation (%) = (final gauge length − original gauge length) ÷ original gauge length × 100
A 50 mm marked length becomes 60 mm after fracture and refitting: (60 − 50) ÷ 50 × 100 = 20% elongation.
Reduction of area: how much thinner at the break
Measure the smallest cross-sectional area at fracture and compare it with the original area. This measures local ductility where the specimen necked. [8]
Reduction of area (%) = (original area − smallest fracture area) ÷ original area × 100
An original area of 100 mm2 becomes 40 mm2: (100 − 40) ÷ 100 × 100 = 60% reduction of area.
Use area, not the percentage change in diameter. Elongation measures longer. Reduction of area measures thinner.
In summary, the longer it gets, or the skinnier it gets, the greater the ductility.
Supervisor note: compare like with like
Gauge length and specimen geometry affect elongation results. Check them before comparing percentages. Elongation after fracture also differs from total extension at the instant of fracture, which includes elastic extension under load. A mixed-zone transverse specimen does not isolate weld-metal ductility.
STRA changes the direction of the pull
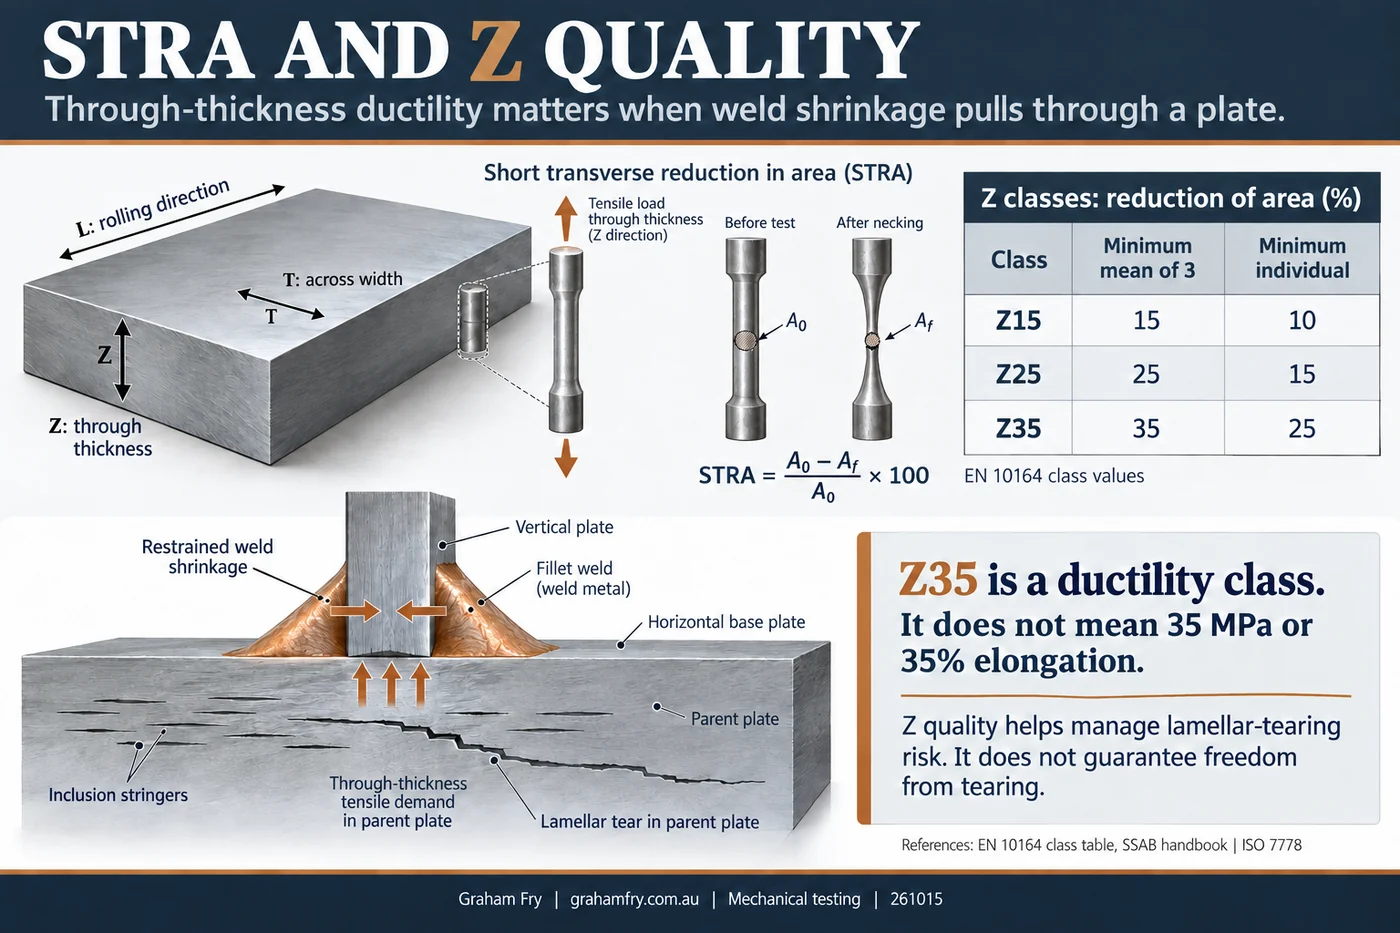
STRA means short transverse reduction of area. The tensile specimen is pulled through the plate thickness, perpendicular to its broad faces. Reduction of area at fracture tells us about ductility in that direction.
Picture three directions: L (longitudinal) along the rolling direction, T (transverse) across the rolling direction, and Z through thickness. Good longitudinal or transverse tensile properties do not establish good through-thickness ductility. [9]
During rolling, non-metallic inclusions can become elongated approximately parallel to the plate faces. In a restrained welded detail, weld shrinkage can demand deformation through the plate thickness. A susceptible plate may develop stepped cracks called lamellar tears, mainly parallel to its surface.
The tear is in the parent plate. The plate is solid steel containing inclusions, not a stack of glued sheets.
Z grade or quality specifies through-thickness properties to help manage this risk. Z35 is not 35 MPa strength or 35% elongation. It does not guarantee freedom from lamellar tearing; joint detail, restraint and welding practice still matter. [10]
Supervisor note: check the specified Z quality and original certificate
The image’s Z15/Z25/Z35 table is explicitly an EN 10164 example. Its mean-of-three and individual minima are not a universal substitute for Australian product requirements. For Australian plate, check the nominated product standard, purchase requirements and manufacturer-certified grade, with traceability to the actual plate. One passing supplemental specimen does not automatically turn ordinary plate into certified Z-grade material. [11]
Hardness asks how difficult it is to make a dent or wear the plate
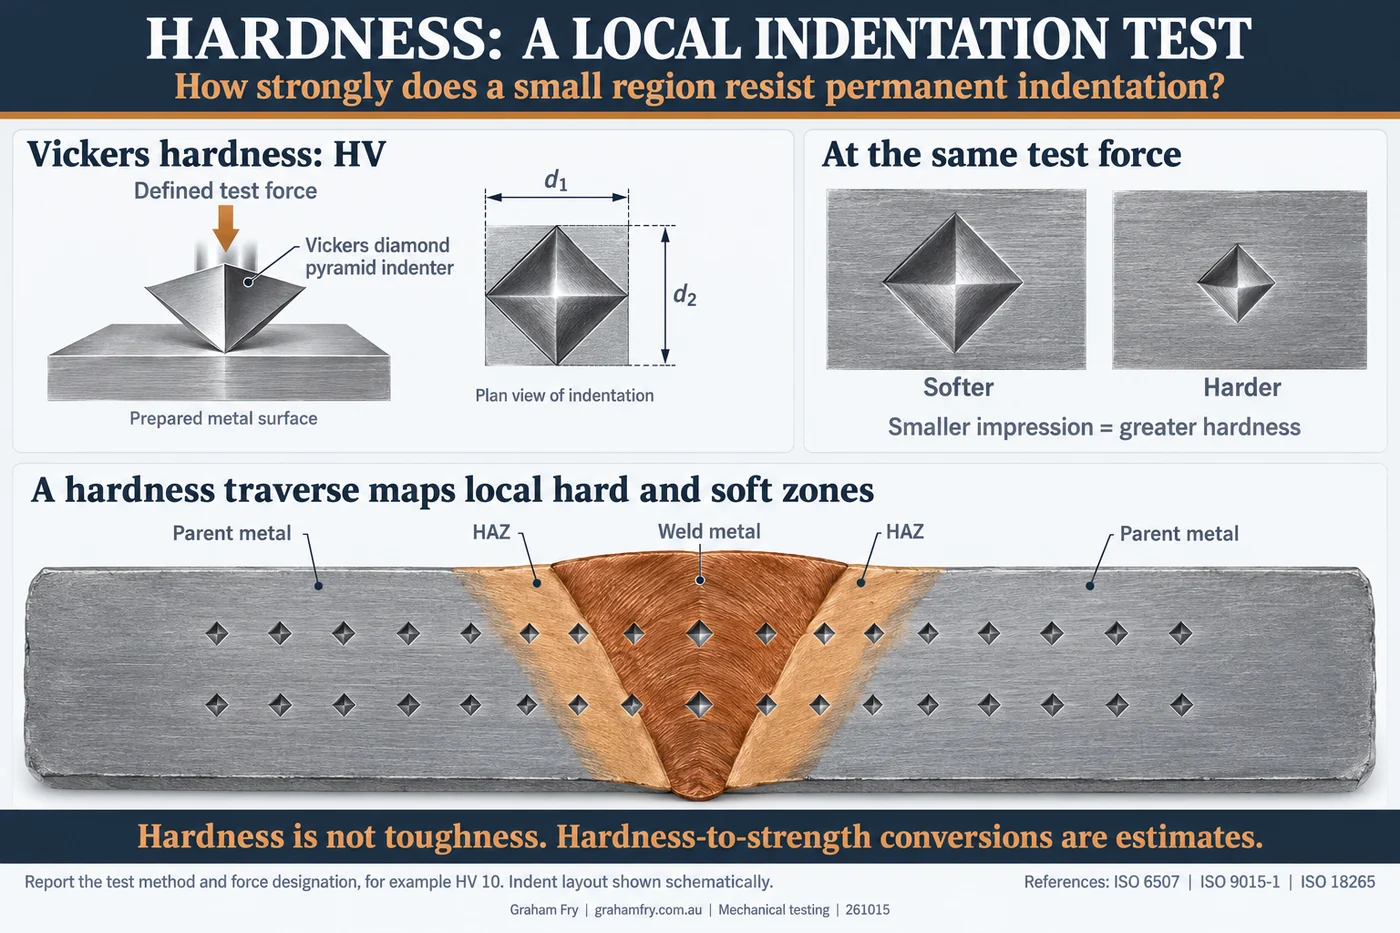
A hardness test makes a controlled indentation. In a Vickers test, a diamond pyramid is pressed into a prepared surface under a defined force. Both diagonals of the remaining impression are measured. At the same test force, a smaller impression means greater hardness. [12]
A hardness traverse places a series of tests across parent metal, HAZ and weld metal. It maps local hard or soft regions. The HAZ does not always become harder; some materials develop softened zones. [13]
Read the method and test designation, such as HV 10, with the result. Vickers, Brinell and Rockwell numbers are not interchangeable labels for one scale.
Why harder steel is often stronger in tension
Hardness and tensile strength are related because both depend on the metal’s resistance to permanent deformation. The hardness indenter makes metal flow locally around a dent. A tensile test pulls a specimen until fracture and records how it responds to the load.
Making internal slip in the metal more difficult can increase both hardness and strength. For comparable carbon and low-alloy steels, a harder condition will often have a higher UTS. That is why material-specific hardness-to-tensile-strength tables can be useful. [18, 19]
It is a correlation, not a universal conversion rule. The relationship depends on the alloy, condition and structure of the material. Use a conversion validated for that material and range; do not apply one multiplier to every metal. A converted tensile strength is an estimate, not a measured tensile result. [14]
For welding supervision, the location matters too. A hard spot in the HAZ is a local result. It does not establish the tensile strength of the whole joint, which may fracture somewhere else. Nor does higher hardness tell you how much the metal will stretch or how much impact energy it will absorb.
Harder does not mean tougher
For a given steel, a harder heat-treated condition often has lower ductility and toughness, particularly after hardening without adequate tempering. A brittle material fractures with little permanent deformation, so it may absorb less energy from an impact. Hardness is resistance to a dent; toughness is resistance to fracture while absorbing energy. [20]
This is a common trade-off, not a universal rule. Some hard steels retain useful toughness, and even a relatively soft HAZ can have poor toughness. Where impact toughness is specified, use the required impact test at the specified temperature. A hardness result cannot replace it. [14]
Supervisor note: a hardness result is not a toughness result
Hardness cannot establish toughness. Even a relatively soft HAZ can have poor toughness. Hardness-to-tensile-strength conversions are estimates with limits, not replacements for the appropriate tensile test. Use the specified method, test locations and acceptance requirements for the material and service. [14]
Toughness asks how the material resists fracture while absorbing energy
A Charpy impact test supports a notched bar near its ends and strikes it with a pendulum on the face opposite the notch. The machine determines the energy absorbed, reported in joules (J). It is a controlled measure of notch impact behaviour. [15]
The conditions belong with the number: test temperature, specimen size, orientation and notch location. A result in joules without that context is incomplete.
Many ferritic steels absorb less impact energy as temperature falls through a transition range. A room-temperature result does not establish low-temperature performance. In a weld, a notch root in weld metal and one at a specified HAZ location also ask different questions. [16]
Remember the chocolate from the fridge
Think of a piece of milk chocolate that is warm enough to soften but is still solid. It can bend and give before breaking, absorbing energy as it deforms. Put the same chocolate in the fridge and it becomes firmer and snaps with much less bending. The same chocolate can absorb less energy before fracture when chilled. [21]
Less give before the snap means more brittle behaviour. Many ferritic steels show a similar practical concern as temperature falls: less plastic deformation and less absorbed impact energy. That is why a toughness result belongs with its test temperature. [16]
Where the analogy ends: chocolate and steel respond through different mechanisms. Chocolate type matters, and not every alloy becomes brittle in the cold. The story cannot convert a hardness result into an impact-energy value, unlike tensile strength and hardness, which are related but only by a material-specific correlation. It is true that harder materials typically have lower toughness.
A pull, a dent and a blow. Different tests, different properties. High tensile strength or hardness does not establish high toughness.
Supervisor note: Charpy energy and fracture toughness are different
Charpy joules are not directly interchangeable with fracture-toughness values such as K, J or CTOD. Here J names a fracture parameter, rather than a Charpy energy in joules. Those parameters require different tests, using specimens with deliberately introduced fatigue cracks, and are used for different engineering questions. A Charpy pass alone does not give a structure’s allowable crack size or safe working load. Compare impact results against the specified temperature, specimen and acceptance conditions. [17]
Read the result with the test conditions
Before accepting a report, work through these checks:
- Identity. Can you trace the sample to the plate, heat, consumable or procedure test?
- Location and direction. What was sampled, and where was the load or notch placed?
- Method and condition. Which test method, specimen dimensions, temperature and heat-treatment condition apply?
- Result. Which property and units are reported? Where did a tensile specimen fracture?
- Requirement. Does the result meet the nominated material, qualification or project specification?
There is no single pass number that covers every metal, welding code and service condition.
What you should do
- Book a time to go to a test lab and watch the tests get done.
- Look for YouTube videos.
- Make your own analogies so it makes sense to you.
Check your understanding
A transverse specimen meets the required strength and breaks in parent metal. Do you know the weld metal’s percentage elongation?
No. The cross-joint result does not isolate weld-metal ductility. A suitable weld-metal specimen is needed to measure that property.
A 50 mm gauge length becomes 60 mm after fracture and refitting. What is the elongation?
20%: the permanent increase is 10 mm, divided by the original 50 mm, multiplied by 100.
A report says “27 J”. Can you decide whether the impact requirement is met?
No. You need the requirement and the test conditions, including temperature, specimen size, orientation and notch location. The example is not a universal acceptance value.
When a report lands on your desk, ask: what does this result demonstrate, and what still needs a different test?
What is verified, what is derived and what is schematic
| Status | What it covers |
|---|---|
| Verified | The test principles, definitions and reported quantities, checked against the published scopes of ISO 5178, ISO 4136, ISO 7778, ISO 9015-1, ISO 9016, ISO 12135 and ISO 18265, and against technical guidance published by TWI, ZwickRoell, NIST, SSAB, BlueScope and SAE. Every source is listed below. |
| Derived | The arithmetic in the worked examples. 20% elongation from 50 mm to 60 mm, 60% reduction of area from 100 mm2 to 40 mm2, 0.2 mm of permanent extension on a 100 mm gauge length, and 0.624 MPa against 62.4 MPa for the same 49 N on 78.5 mm2 and 0.785 mm2. These are calculated from the stated example figures. None of them is taken from a test report. |
| Schematic | Every curve and diagram on this page is a teaching illustration, not plotted test data. That includes the stress-strain curves in Figures 7 and 8 and the Charpy transition curve in Figure 12. Specimen fracture locations shown are examples, not universal outcomes. |
| Example only | The Z15, Z25 and Z35 minima in Figure 10 are an EN 10164 class table, reproduced to show the shape of such a table. They are not Australian requirements and they are not a substitute for the nominated product standard and purchase specification. |
| Analogy | The chain, the spring and the chocolate are memory aids, not models. Each carries its stated limit in the text beside it. |
| Not reproduced | No proprietary standard text. Standard scopes and public technical guidance informed the explanations; full standards have not been reproduced. |
This page qualifies nothing
It explains what mechanical tests measure. It does not set acceptance criteria, approve a welding procedure, qualify a welder, qualify a consumable or accept a material. Carry out and assess testing to the editions and requirements nominated for your work, and read every result against the specification that governs it. Where a judgement call sits between the result and the acceptance decision, that call belongs to a competent person with the drawing, the specification and the job in front of them.
Sources and method context
This resource explains test principles. Carry out and assess testing to the editions and requirements nominated for the work. Public standard scopes and technical guidance informed the explanations; full proprietary standards have not been reproduced.
- ISO 5178:2019, longitudinal tensile testing of weld metal.
- Lincoln Electric, typical all-weld-metal data and application limitations.
- ISO 4136:2022, transverse tensile testing; TWI, tensile testing part 2.
- Instron, elastic limit.
- ZwickRoell, yield and proof strength; TWI, tensile testing part 1.
- ZwickRoell, tensile strength and necking.
- ZwickRoell, elongation after fracture; TWI, gauge-length measurement.
- ZwickRoell, reduction of area.
- ISO 7778:2014, through-thickness properties.
- TWI, lamellar tearing; SSAB handbook, EN 10164 class table 5.6.
- BlueScope, plate grade designations and manufacturer certification.
- ZwickRoell, Vickers testing; Buehler, Vickers testing.
- ISO 9015-1, weld hardness testing; SSAB, Welding of Strenx, hardness distribution.
- TWI, HAZ hardness and toughness; ISO 18265, hardness conversions.
- NIST, Charpy testing programme; ZwickRoell, Charpy test arrangement.
- NIST, Charpy transition curves; ISO 9016:2022, weld impact specimen location and notch orientation.
- ISO 12135:2021, fracture-toughness testing.
- SAE J413_202412, hardness and tensile-property relationships in heat-treated wrought steels.
- US Department of Energy, Materials Science Fundamentals Handbook, volume 1, properties of metals and slip mechanisms (archived).
- TWI, heat treatment and tempering; NIST, Heat Treatment and Properties of Iron and Steel.
- L B Parsons and R Goodall, University of Sheffield, Testing the fracture behaviour of chocolate, section 4.2.
Graham Fry, Welder | International Welding Engineer
Welding and fabrication consultant and expert witness, working with asset owners, fabricators and OEMs in Australia and internationally on procedure and welder qualification, pressure equipment compliance, failure analysis and welding management systems.